
A mobile robot completes its route perfectly for most of the day, then pauses beside a pallet, reports an obstacle that is not there, and recovers before anyone can inspect it. The next run is normal. The one after that fails in a different aisle.
These are the failures that consume engineering time. A hard failure that happens on every startup is often easier to reproduce, isolate, and repair. An intermittent failure leaves behind uncertainty: was it the sensor, the network, the controller, the environment, or an interaction between several ordinary conditions?
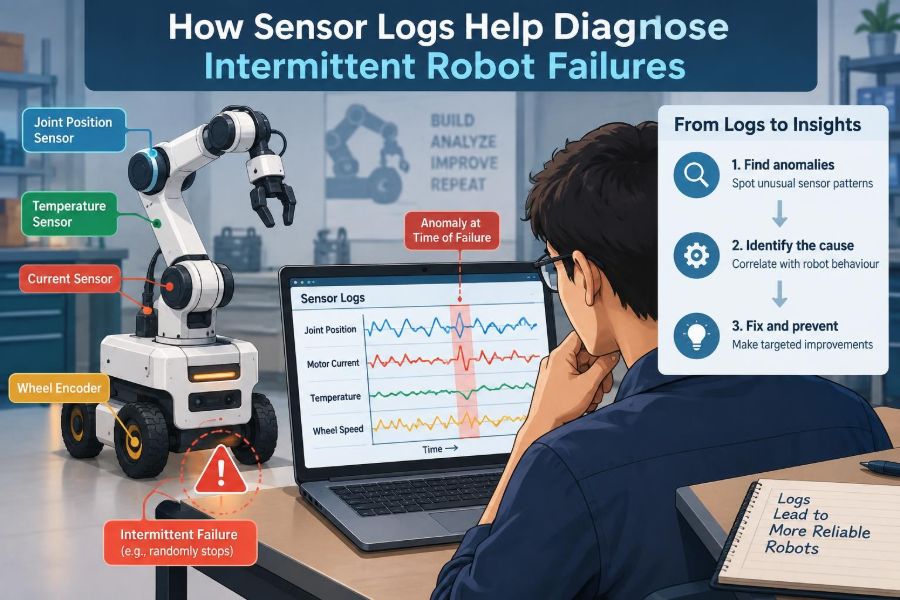
Sensor logs turn that uncertainty into evidence. They preserve what the robot perceived, when it perceived it, and sometimes how confident it was in the measurement. Used carefully, they can reveal a pattern that a technician watching the robot never gets a chance to see.
The goal is not merely to collect more data. It is to capture the right signals, with trustworthy time and useful context, then compare failure windows against healthy operation.
🤖 Why Intermittent Failures Are Different
An intermittent failure appears only under certain conditions: a particular turn, lighting angle, battery state, radio load, temperature, payload, or software timing. Several conditions may need to coincide, which is why a robot can pass a bench test and still fail on a production floor.
The visible symptom may also be delayed. A brief encoder dropout can lead to poor localization seconds later. A processor overload can cause stale camera frames, which later appear as a perception error. The first warning in a log is not always the moment the robot stops.
📒 What a Sensor Log Actually Records
A sensor log is a time-ordered record of measurements and related metadata. Depending on the system, it may include raw samples, processed estimates, message arrival times, error flags, calibration versions, and controller commands.
Raw data answers “what did the device report?” Derived data answers “what did the software believe?” Both matter. A lidar may have produced a valid scan while the localization process rejected it, or a camera pipeline may have received no usable frame at all.
🔍 Treat the Symptom as a Clue, Not a Cause
“The robot stopped” is a symptom, not a diagnosis. It could have stopped because a safety controller received a protective field violation, because localization confidence fell below a limit, or because a drive controller rejected a command.
Start by translating the observed behavior into a small set of candidate system events. For example, an unexpected stop near reflective shelving might direct attention to lidar range quality, safety-zone configuration, localization residuals, and the robot’s pose—not immediately to the drive motors.
⏱️ Time Synchronization Makes Comparisons Possible
Logs are only as useful as their timing. If the camera timestamps data at capture, the computer timestamps it at receipt, and the motor controller timestamps it with an unsynchronized clock, apparent cause and effect can be misleading.
Use a shared time source where practical, and record which clock produced each timestamp. Also distinguish event time from arrival time. A network delay may make a valid message look late unless both are available.
🧭 Build a Timeline Around the Failure
For every incident, define a time window that starts before the symptom and extends beyond recovery. The window should include robot state transitions, sensor streams, actuator commands, safety events, compute health, and operator actions.
A useful timeline often shows a chain rather than a single fault: wheel slip begins during a turn, odometry diverges, scan matching quality declines, localization changes mode, and navigation commands a stop. That sequence is more actionable than a final “navigation failed” message.
🩺 Capture Robot Health Alongside Perception
Sensor readings should not be separated from the conditions under which they were produced. CPU utilization, memory pressure, storage latency, battery voltage, temperature, bus errors, and network packet loss can all alter sensor availability or processing quality.
For instance, a depth camera may seem unreliable only because its processing queue grows during a computationally expensive mapping task. The frames are not necessarily bad; they may be processed too late to guide motion safely.
📡 Know the Failure Signatures of Common Sensors
Different sensors fail in different ways. Learning their signatures makes a first pass through a log much faster.
| Sensor | Useful log clues | Possible interpretation |
|---|---|---|
| Wheel encoder | Count jumps, missing updates, disagreement between wheels | Loose connection, noise, wheel slip, mechanical issue |
| IMU | Bias drift, clipped acceleration, irregular sample intervals | Vibration, saturation, timing issue, thermal change |
| Lidar | Invalid returns, reduced point count, repeated range bands | Contamination, reflective surface, interference, obstruction |
| Camera | Exposure shifts, dropped frames, blur, timestamp gaps | Lighting change, motion, bandwidth or compute limit |
| Ultrasonic sensor | Persistent near readings or erratic echoes | Multipath reflection, mounting angle, surface properties |
These signatures are hypotheses, not proof. A missing sensor message can originate in the device, cable, driver, middleware, operating system, or logger.
🧾 Preserve Raw Data Before It Is Lost
High-level status codes are compact, but they discard detail. If storage and privacy requirements permit, retain raw samples for a bounded period around faults: image frames, point clouds, IMU packets, encoder counts, and bus messages.
Raw data allows engineers to replay improved algorithms and test whether the original interpretation was flawed. It also prevents a common dead end: discovering that a “bad measurement” flag was set without knowing what measurement triggered it.
🧠 Log Derived Estimates and Their Confidence
Raw sensor data alone does not explain a robot’s decisions. Log state estimates such as pose, velocity, map alignment score, detected objects, and the confidence or covariance associated with them.
Confidence values need interpretation. A low confidence can be expected while entering a new area; a sudden collapse during an otherwise familiar route is more suspicious. Record thresholds that caused a state transition so an investigator can see why the software acted.
🔗 Follow the Data Path, Not Just the Device
A measurement travels through a chain: sensor hardware, cable or radio link, driver, transport, middleware, processing node, estimator, planner, and controller. An intermittent issue anywhere in that chain can look like a sensor fault.
Logs should expose handoff points. Compare device sequence numbers with received message counts, queue depth with processing latency, and processed outputs with controller inputs. This identifies whether data was absent, delayed, malformed, rejected, or simply outweighed by other evidence.
📉 Watch Rates, Gaps, and Jitter
Many failures hide in timing rather than value. A sensor can report plausible measurements but do so irregularly. Jitter is variation in the interval between samples, while a gap is a missing period entirely.
Compute expected sample intervals and flag departures that matter to the application. A control loop may tolerate a delayed environmental scan but not delayed inertial data. Analyze distributions over healthy and failing runs instead of relying only on average rates.
🎞️ Use Sequence Numbers to Detect Silent Loss
Timestamps can reveal delay, but sequence numbers reveal missing messages. If a stream moves from frame 10,421 to 10,425, three messages did not reach the logging point, even if the next frame looks normal.
Keep sequence counters close to the source when possible. A counter added after a transport layer cannot distinguish data never sent from data dropped earlier in the chain.
🌡️ Correlate Failures With Operating Conditions
Intermittent behavior often has a physical context. Compare incidents by battery level, electronics temperature, ambient light, floor surface, payload mass, travel speed, route segment, and time since startup.
Correlation is a lead, not a verdict. If failures occur after long operation, temperature may matter—but so might an increasingly full log disk, a memory leak, changing warehouse activity, or a task scheduled at the same time.
🧱 Map Events to Physical Location
For mobile robots, location is frequently the missing dimension. Tag incidents with map coordinates, heading, route phase, and nearby features. A cluster near one doorway may implicate sunlight, floor transitions, radio coverage, or a repeated localization ambiguity.
Be careful when pose quality is itself under investigation. It can be useful to compare a planned location, an estimated location, and any independent reference available during testing.
💡 Account for Environment-Specific Perception Problems
Sensors observe the world through physical mechanisms. Bright sunlight can challenge cameras and some optical depth sensors. Glass, polished metal, dust, fog, narrow corridors, and acoustic reflections can affect different devices in different ways.
A hypothetical robot that sees a phantom obstacle only near shrink-wrapped pallets may be receiving strong or unusual lidar reflections. The correct response is not automatically to suppress the reading; inspect the raw return pattern, safety requirements, and the effect of any filter on real obstacles.
⚙️ Compare Good Runs With Bad Runs
The most informative baseline is often a healthy run over the same route under similar conditions. Align logs by a meaningful event, such as entering an aisle or beginning a turn, rather than only by wall-clock time.
Then ask concrete questions: Did the lidar point count decline first? Did IMU variance increase? Did a queue build before dropped frames began? A difference that consistently precedes the failure deserves priority over a difference that appears afterward.
🧪 Reproduce Conditions, Not Just Symptoms
Once logs suggest a trigger, construct a controlled test that recreates the relevant conditions. This may mean matching speed, payload, lighting, surface, temperature, wireless traffic, or software workload.
Change one major variable at a time when safety and schedule permit. If several changes are made together, an apparent fix may be impossible to attribute. Reproduction does not need to occur on demand immediately; a more frequent, well-instrumented version of the failure is often enough.
🧷 Separate Sensor Error From Sensor Disagreement
A sensor that disagrees with the estimate is not necessarily wrong. An IMU may indicate rotation while wheel encoders do not because the wheels are slipping. In that case, the disagreement is valuable evidence about the robot’s contact with the floor.
Use independent modalities where possible. Compare wheel odometry with visual motion, lidar-based movement with IMU integration, or an object detector with a safety sensor. The aim is to identify which assumption failed, not to declare the first outlier defective.
🧮 Understand Filters and Sensor Fusion
Most robots combine readings through a filter or estimator. Sensor fusion can improve robustness, but it can also hide a problem when other sources compensate for a drifting measurement.
Log residuals: the difference between a predicted measurement and an observed one. Also log innovations, accepted or rejected updates, and any mode changes. These records show whether the estimator distrusted a sensor, was overwhelmed by it, or continued using stale information.
🚨 Treat Safety Logs as First-Class Evidence
Safety-rated components may use separate controllers, diagnostics, and data retention rules. Their logs can explain a protective stop that application-level software describes only as an interruption.
Do not use debugging convenience to weaken safety functions or disable protective zones in a live environment. Any test involving safety behavior should follow the robot’s risk assessment, site procedures, and applicable engineering controls.
🖥️ Include Software and Configuration Identity
A log without configuration context is difficult to compare. Record software build identifiers, model versions, calibration files, parameter sets, map revisions, firmware versions, and active feature flags.
Small changes can alter behavior substantially. A revised exposure setting may affect camera detections; a changed coordinate transform may resemble a mechanical mounting error. Configuration capture converts “it started after an update” into something that can be examined precisely.
🧹 Detect Bad Data Without Deleting Evidence
Validation checks should flag impossible or suspicious values: non-finite numbers, out-of-range readings, malformed packets, duplicate timestamps, or unrealistic jumps. But avoid silently discarding them before incident capture.
Retain the original record and annotate why it was considered invalid. A corrupted packet may point to an electrical or transport issue, while an “impossible” acceleration spike may reveal vibration or a unit-conversion defect.
💾 Design Logging for Limited Storage and Bandwidth
Logging every raw stream continuously can exhaust storage, increase compute load, or create privacy concerns. A practical design uses tiers: lightweight health metrics all the time, richer data during unusual conditions, and a rolling buffer that preserves the minutes before and after a trigger.
Test the logger itself. If logging causes dropped frames or delayed control messages, it changes the system being observed. Measure overhead, define retention limits, protect access, and decide what happens when storage is full.
🔐 Handle Sensitive Sensor Data Responsibly
Camera, audio, location, and facility data may identify people, expose layouts, or reveal operational activity. Diagnostic value does not remove the need for appropriate access controls and retention practices.
Minimize collection where feasible, restrict who can retrieve incident bundles, and redact or transform data when the diagnosis does not need full detail. Requirements vary by deployment, so teams should align logging practices with organizational policy and applicable obligations.
🛠️ Create an Incident Bundle Automatically
When a fault condition occurs, save a consistent package rather than asking someone to assemble files later. Include the event timeline, relevant sensor windows, health metrics, configuration identity, route context, and any operator-entered observation.
Use clear identifiers that connect the bundle to the robot, mission, and software version. The package should make it possible for another engineer to investigate without relying on memories of a brief event.
🧭 Use a Repeatable Investigation Workflow
- State the visible symptom and exact time window.
- Identify the subsystem decision that created the symptom.
- Trace its inputs backward through the data path.
- Compare the same signals with healthy runs.
- Form a testable hypothesis, including alternative explanations.
- Reproduce or simulate the relevant conditions.
- Apply one controlled change and verify both the fix and unintended effects.
This workflow resists the temptation to replace a sensor simply because it was involved in the last visible error.
❌ Avoid the Most Common Logging Mistakes
- Logging only errors: the missing lead-up often contains the cause.
- Using unsynchronized clocks: false ordering can send an investigation in the wrong direction.
- Recording averages only: brief spikes and gaps disappear.
- Omitting configuration: runs become incomparable after updates.
- Keeping no healthy baseline: unusual values cannot be placed in context.
- Assuming correlation is causation: a shared timestamp may be coincidence or a downstream effect.
📊 Choose Alerts That Lead to Action
An alert should correspond to a condition someone can investigate or mitigate. “Camera frame rate below expected for several seconds” is often more useful than a vague “perception degraded,” especially when it includes the stream, queue depth, and current compute load.
Too many low-value alerts train teams to ignore them. Start with a small set tied to known failure modes, then refine thresholds using operational data and incident reviews.
👥 Make Logs Usable Across Disciplines
Mechanical, electrical, software, controls, and operations teams may use different vocabulary and tools. An incident view should connect a physical observation—such as a wheel crossing a floor seam—to encoder behavior, estimator response, and controller action.
Shared event definitions help. Decide what “dropout,” “stale,” “degraded,” “protective stop,” and “recovery” mean in your system. Ambiguous labels produce ambiguous conclusions.
🧰 Start With a Practical Minimum Log Set
A new project does not need perfect observability on day one. Begin with time-synchronized core sensor summaries, raw data around triggered incidents, robot pose and confidence, actuator commands, safety state, compute health, configuration identity, and a mission or route marker.
Review early incidents to find what was missing, then improve the schema deliberately. Logging becomes valuable when it answers real questions faster, not when it produces the largest archive.
🎯 The Core Principle: Preserve Context Around Decisions
Intermittent robot failures are rarely solved by a single alarming value. They are solved by reconstructing the conditions and decisions that turned ordinary measurements into unexpected behavior.
The best sensor logging strategy therefore preserves context: what the robot sensed, how fresh and trustworthy the data was, what other systems were doing, what software interpreted it, and why the robot acted. That context supports careful diagnosis, safer testing, and fixes that address causes rather than recurring symptoms.
When a robot fails only sometimes, the most useful evidence is a well-timed record of the whole decision chain—not just the final error message. 🛠️📈🤖